
3.1.6.1.1.2. Plotting simple quantities of a pandas dataframe
This example loads from a CSV file data with mixed numerical and categorical entries, and plots a few quantities, separately for females and males, thanks to the pandas integrated plotting tool (that uses matplotlib behind the scene).
http://pandas.pydata.org/pandas-docs/stable/visualization.html を見ましょう。
Python ソースコード: plot_pandas.py
import pandas
data = pandas.read_csv('brain_size.csv', sep=';', na_values='.')
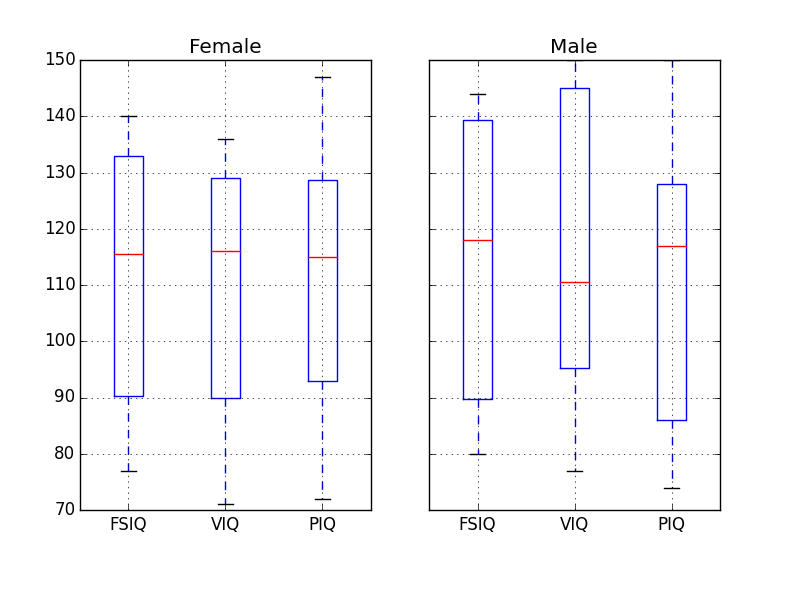
# Box plots of different columns for each gender
groupby_gender = data.groupby('Gender')
groupby_gender.boxplot(column=['FSIQ', 'VIQ', 'PIQ'])
from pandas.tools import plotting
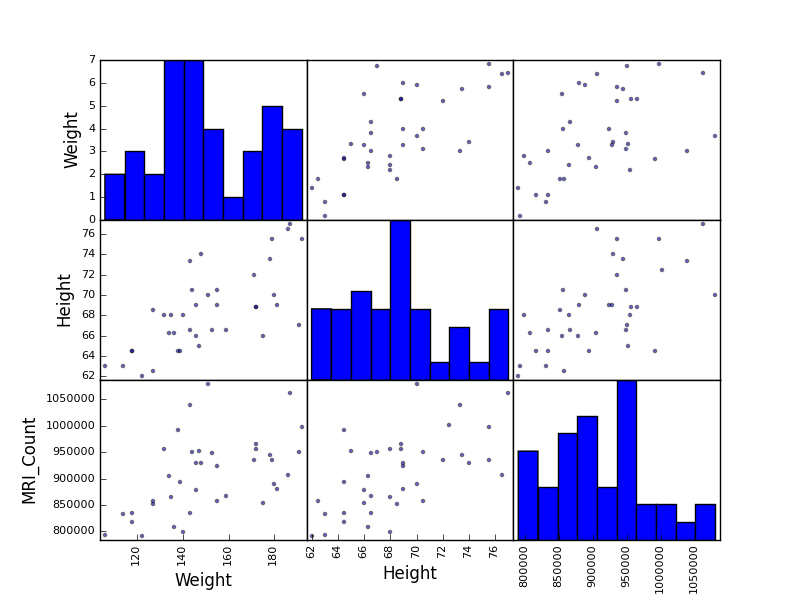
# Scatter matrices for different columns
plotting.scatter_matrix(data[['Weight', 'Height', 'MRI_Count']])
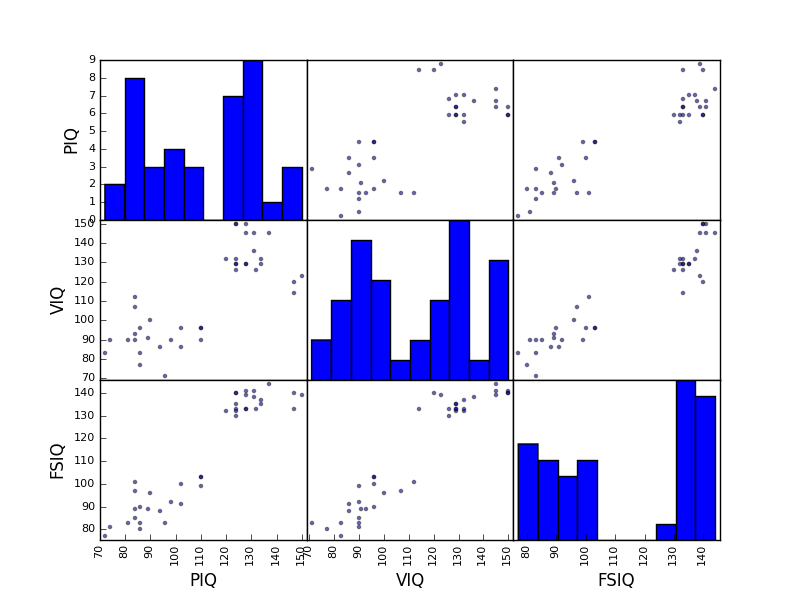
plotting.scatter_matrix(data[['PIQ', 'VIQ', 'FSIQ']])
import matplotlib.pyplot as plt
plt.show()
Total running time of the example: 1.99 seconds ( 0 minutes 1.99 seconds)