
散布図で点をプロット
散布図で点をプロットするやりかたの例。
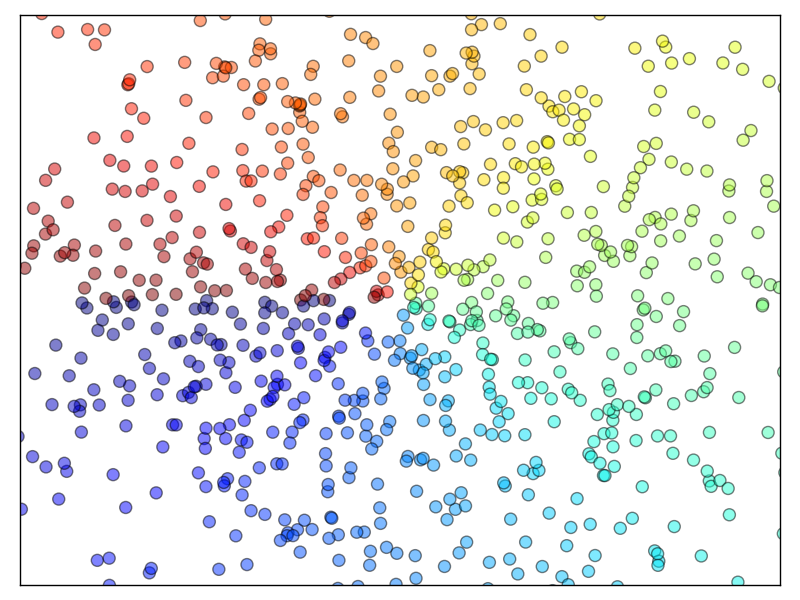
Python ソースコード: plot_scatter_ex.py
import numpy as np
import matplotlib.pyplot as plt

n = 1024
X = np.random.normal(0, 1, n)
Y = np.random.normal(0, 1, n)
T = np.arctan2(Y, X)

plt.axes([0.025, 0.025, 0.95, 0.95])
plt.scatter(X, Y, s=75, c=T, alpha=.5)

plt.xlim(-1.5, 1.5)
plt.xticks(())
plt.ylim(-1.5, 1.5)
plt.yticks(())

plt.show()
Total running time of the example: 0.05 seconds ( 0 minutes 0.05 seconds)