
散布図のプロットと装飾
装飾を加えて散布図を表示する例。
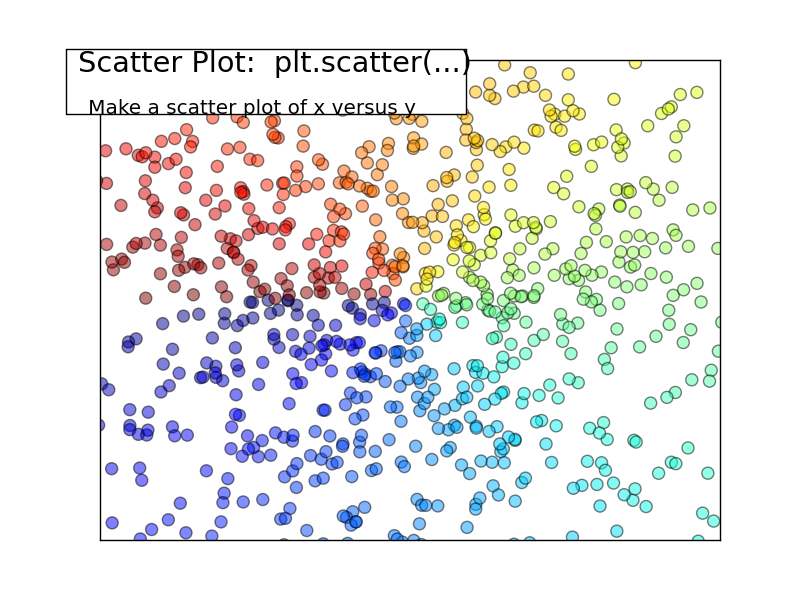
Python ソースコード: plot_scatter.py
import numpy as np
import matplotlib.pyplot as plt

n = 1024
X = np.random.normal(0, 1, n)
Y = np.random.normal(0, 1, n)

T = np.arctan2(Y,X)

plt.scatter(X, Y, s=75, c=T, alpha=.5)
plt.xlim(-1.5, 1.5)
plt.xticks(())
plt.ylim(-1.5, 1.5)
plt.yticks(())

plt.text(-0.05, 1.02, " Scatter Plot:  plt.scatter(...)\n",
      horizontalalignment='left',
      verticalalignment='top',
      size='xx-large',
      bbox=dict(facecolor='white', alpha=1.0, width=400, height=65),
      transform=plt.gca().transAxes)

plt.text(-0.05, 1.01, "\n\n   Make a scatter plot of x versus y ",
      horizontalalignment='left',
      verticalalignment='top',
      size='large',
      transform=plt.gca().transAxes)

plt.show()
Total running time of the example: 0.12 seconds ( 0 minutes 0.12 seconds)