
矢印プロットと装飾
装飾を加えて矢印を表示する例。
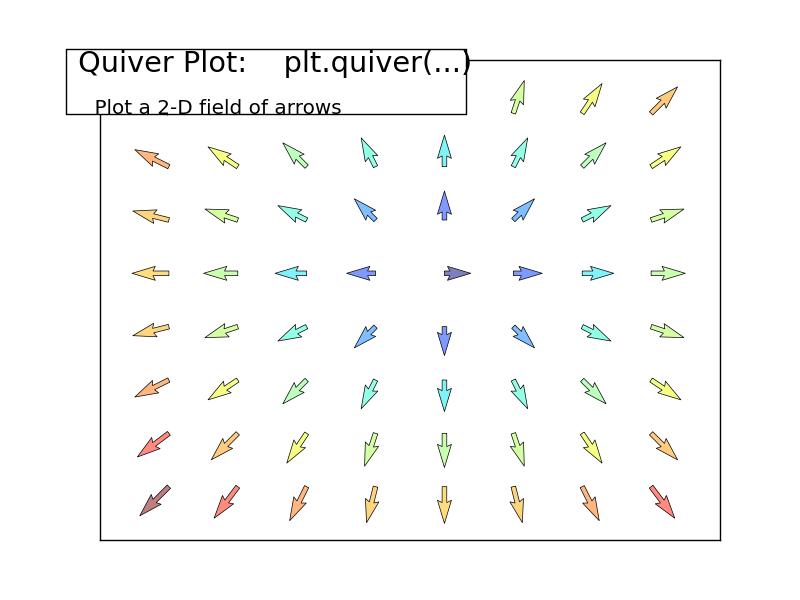
Python ソースコード: plot_quiver.py
import numpy as np
import matplotlib.pyplot as plt

n = 8
X, Y = np.mgrid[0:n, 0:n]
T = np.arctan2(Y - n/ 2., X - n / 2.)
R = 10 + np.sqrt((Y - n / 2.) ** 2 + (X - n / 2.) ** 2)
U, V = R * np.cos(T), R * np.sin(T)

plt.quiver(X, Y, U, V, R, alpha=.5)
plt.quiver(X, Y, U, V, edgecolor='k', facecolor='None', linewidth=.5)

plt.xlim(-1, n)
plt.xticks(())
plt.ylim(-1, n)
plt.yticks(())

plt.text(-0.05, 1.02, " Quiver Plot:    plt.quiver(...)\n",
      horizontalalignment='left',
      verticalalignment='top',
      size='xx-large',
      bbox=dict(facecolor='white', alpha=1.0, width=400, height=65),
      transform=plt.gca().transAxes)

plt.text(-0.05, 1.01, "\n\n    Plot a 2-D field of arrows ",
      horizontalalignment='left',
      verticalalignment='top',
      size='large',
      transform=plt.gca().transAxes)

plt.show()
Total running time of the example: 0.06 seconds ( 0 minutes 0.06 seconds)