
極表示でのプロットと装飾
極座標表示でのプロットの仕方の例といくつか装飾を加えて。
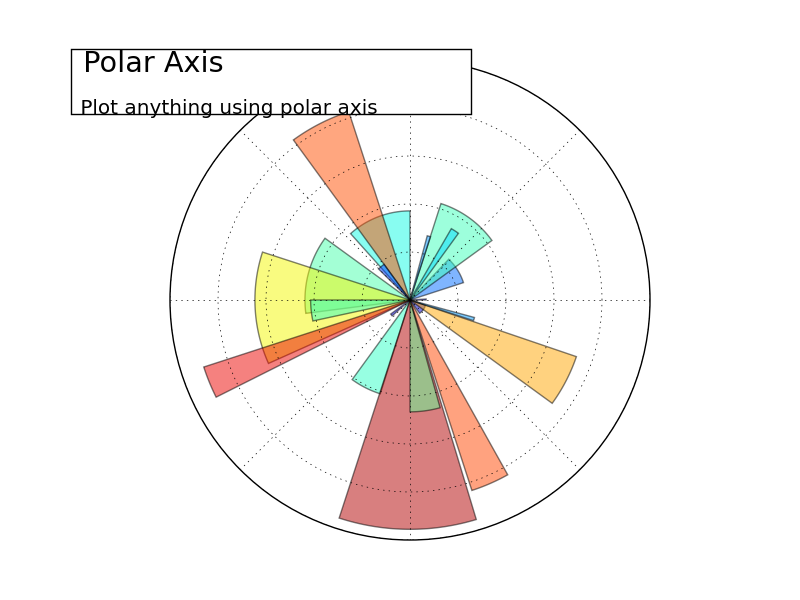
Python ソースコード: plot_polar.py
import numpy as np
import matplotlib.pyplot as plt

plt.subplot(1, 1, 1, polar=True)

N = 20
theta = np.arange(0.0, 2 * np.pi, 2 * np.pi / N)
radii = 10 * np.random.rand(N)
width = np.pi / 4 * np.random.rand(N)
bars = plt.bar(theta, radii, width=width, bottom=0.0)
for r, bar in zip(radii, bars):
    bar.set_facecolor(plt.cm.jet(r / 10.))
    bar.set_alpha(0.5)
plt.gca().set_xticklabels([])
plt.gca().set_yticklabels([])

plt.text(-0.2, 1.02, " Polar Axis\n",
      horizontalalignment='left',
      verticalalignment='top',
      size='xx-large',
      bbox=dict(facecolor='white', alpha=1.0, width=400, height=65),
      transform=plt.gca().transAxes)
plt.text(-0.2, 1.01, "\n\n Plot anything using polar axis ",
      horizontalalignment='left',
      verticalalignment='top',
      size='large',
      transform=plt.gca().transAxes)

plt.show()
Total running time of the example: 0.08 seconds ( 0 minutes 0.08 seconds)