
単純な axes の例
この例でいくつかの単純な axes の使い方を示します。
Python source code: plot_axes.py
import matplotlib.pyplot as plt
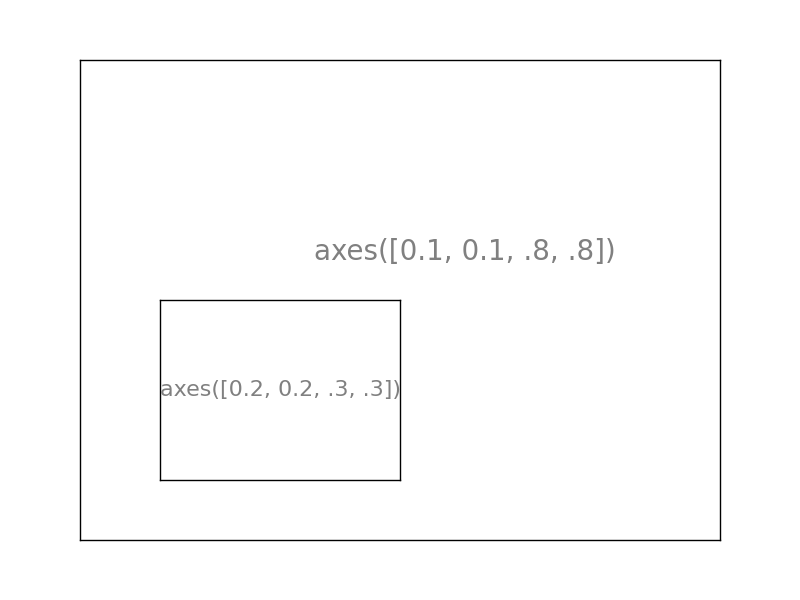
plt.axes([.1, .1, .8, .8])
plt.xticks(())
plt.yticks(())
plt.text(.6, .6, 'axes([0.1, 0.1, .8, .8])', ha='center', va='center',
size=20, alpha=.5)
plt.axes([.2, .2, .3, .3])
plt.xticks(())
plt.yticks(())
plt.text(.5, .5, 'axes([0.2, 0.2, .3, .3])', ha='center', va='center',
size=16, alpha=.5)
plt.show()
Total running time of the example: 0.11 seconds ( 0 minutes 0.11 seconds)